Stock market prediction is usually considered as one of the most challenging issues among time series predictions due to its noise and volatile features. People have come up with many techniques to deal with the noise part, one of the most common approaches being decomposing the signal using Fourier Transform or Wavelet transform on input variables. Any time series can be decomposed into a trend (the systematic component which does not repeat itself), seasonality (the systematic component which does repeat) and noise (the non-systemic component of the signal). By non-systematic, I mean the part which can’t be modeled and thus needs to be removed from the signal before applying any learning technique.
But, what if we could teach the model to learn itself which part of the input signal the noise is? Attention is all you need (:P). Attention mechanism has gained wide popularity in machine translation (eg: French to English) because of the significant improvement in results and less time required to train them for the same translation task. In this project, I applied a dual attention mechanism (inspired by this paper) to forecast Dow Jones Industrial Average stock index closing price for the next 54 days. Why DJIA? Because it trades in NY stock exchange, which is commonly considered as the most advanced financial market (and mature) in the world.
Coming to the choice of input variables, I use the daily trading data (opening price and trading volume). Also, I added some technical indicators (description below) and macroeconomic variables (Exchange rate and Interest rate). Without a doubt, the macroeconomic conditions across regions also play critical roles in influencing the performance of the stock market. Specifically, I chose US dollar index as the proxy for the exchange rate. It is acknowledged that the US dollar plays the most important role in the monetary market. Therefore, it alone could be enough to capture the impact from the monetary market to the stock market. For the interest rate, I use the federal funds rate in the US. For the choice of technical indicators, I referred to this paper and have briefly described them below.
1. Moving average convergence divergence: It is supposed to reveal changes in the strength, direction, momentum, and duration of a trend in a stock's price
2. Commodity Channel Index: A very common tool for traders in identifying cyclical trends in commodities
3. Average true range: Measures the volatility of prices
4. Bollinger Band: Provides a relative definition of high and low prices of a market
5. 20-day exponential moving average
6. 10-day moving average
7. 6-month momentum
8. Price rate of change: A pure momentum oscillator that measures the percent change in price from one period to the next
In the model, I use an input attention mechanism in the encoder (a GRU) which will learn to focus on the relevant driving series among the inputs. The encoder is followed by a decoder (another GRU) which consists of a separate temporal attention mechanism which will learn to pay attention to the relevant encoder’s hidden state across the time steps we feed to it. By paying attention, I mean that the inputs are transformed into a context vector which indicates how much attention the next layer of the network should pay to that particular input. Before feeding in the input features and target variables, I normalize (different from standardizing) both of them. I train the model on 4 years data of stock index and the validation set consists of the stock index prices of 2 months and the 2 months stock prices after that are used for the test set.
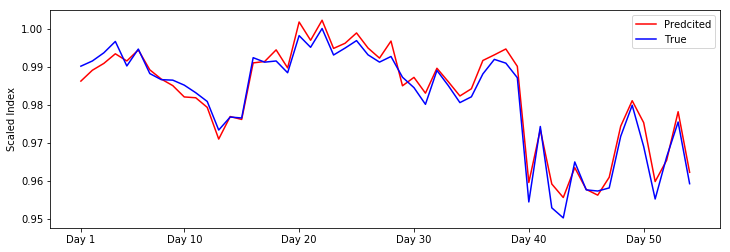
The model is trained to predict the next day’s stock closing price and for predicting the prices for subsequent days, I use the last day’s predicted price as the closing price instead of the true price. A popular theory in financial economics, the efficient-market hypothesis (Wikipedia) says that asset prices fully reflect all available information. This theory contends that since markets are efficient and current prices reflect all information, attempts to outperform the market are essentially a game of chance rather than one of skill which implies that the current prices only reflect information from past and contain no information of future.
The evaluation metrics I chose are directional accuracy and MSE. MSE is used for training the model while the model performing best on the validation set in terms of both MSE and directional accuracy is chosen as the final one on which testing is performed. By using MSE I train it to learn how to predict the next value of index but more than that, what I am interested in is if it can predict the trend i.e. it can indicate if the price is going to increase or decrease because, in algorithmic trading, a buy signal is when the predicted value of next day is higher than the current value and a sell signal is when the predicted value of next day is less than the current value. Finally, after training and evaluation, the final model gives 92% directional accuracy on the test set. If I assume the stock index to be a random walk, I will achieve 50% directional accuracy by predicting everything goes up or down for the whole period but the MSE will be high.
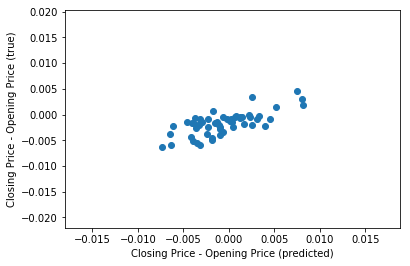
I am always skeptical of good results. Now since I am providing daily opening price, it may be that the model just outputs the daily opening price as the closing price. To test for that, I plotted the difference between true closing price and opening price against the difference between predicted closing price and opening price. The scatter plot obtained proves that this hypothesis is false. Also, the correlation between both the differences is 0.7 which is high enough to disprove the hypothesis which means the model is actually learning something.
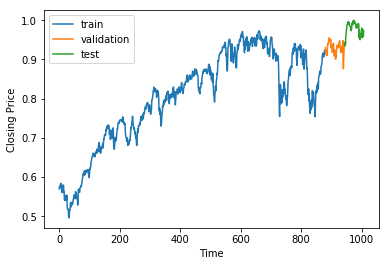
Now, it may be true that the model is performing well only on the period for forecast chosen because the stock index is fairly stable then. For example, if I show you the whole graph, the last part (green) is where the model is tested on which is quite stable compared to the earlier dips and rises.
Show me the code
Code: GitHub
If anyone tries to use the model and gets rich by any chance, let me know (:P).
Thanks,
Ashwin